Monday, October 31, 2011

Handling Plots with RCallerPhp Edition

Now we have RCaller Php edition, named RCallerPhp, which is able to handle images generated by R. I hope it will bring an other easy solution for calling R from other platforms.

With this feature, web developers that use Php as their main language and need calculations done by R will easly use this library.

It is distributed as its big brother, RCaller Java Edition, with the LGPL (Lesser GNU Public License).
RCallerPhp is intended to be compatible as much as possible with the Java version. So, investigating the old examples may be helpful for understanding this new release.

In a time of less than a week, we released this version without the plotting support. By now, generating R plots and showing them in a browser is implemented. Generated plots are stored in the temp directory instead www directory. That is why we are encoding generated plots inside the img src tags with base64 encoding. You can have a look at the source code at RCaller source code at Google project hosting.

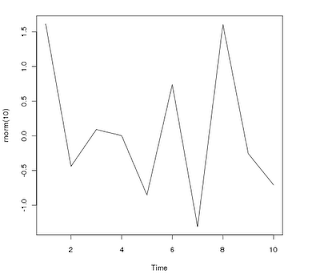
Handling plots with RCallerPhp is quite easy. Let's have a look at the code below:

<?php

require_once("../RCode.php");
require_once("../RCaller.php");
require_once("simpletest.php");

$caller = new RCaller();
$code = new RCode("");

$plot = $code->startPlot();
$code->addRCode("plot.ts(rnorm(10))");
$code->endPlot();

$caller->setRscriptExecutable("/usr/bin/Rscript");
$caller->setRCode($code);
$caller->runOnly();

print($caller->getPlot($plot));
?>

Here is the generated output, which is copied from the web browser:


Nothing is easier than this! Do not hasitate to ask anything about RCaller.
We hope you enjoy...
Have fun...

Sunday, October 30, 2011

RCallerPhp is ready for testing

Hey web guys! RCaller now supports Php and we are planning to carry RCaller to other platforms and languages. The first step of our attack plan was to implement a Php edition and it is ready for testing now.

The second step is to implement RCaller for Perl and Python. We have now our Perl developer and he is in progress. Python is not our primary language and we are waiting for your helps. If you are familier with R and a developer of one of those languages below, join us. We are planning to carry RCaller to

  • Python
  • .Net
at first.

And... How it looks like.. Let's give up Java and speak Php for a minute:

 1 <?php
 2 include_once ("RCaller.php");
 3 
 4 $rcaller = new RCaller();
 5   $rcaller->setRscriptExecutable("/usr/bin/Rscript");
 6   $rcode = new RCode("");
 7   $rcode->clear();
 8   $rcode->addRCode("mylist <- list(x=1:3, y=c(7,8,9))");
 9 
10   $rcaller->setRCode($rcode);
11   $rcaller->runAndReturnResult("mylist");
12 
13   $x = $rcaller->getParser()->getAsStringArray("x");
14   $y = $rcaller->getParser()->getAsStringArray("y");
15 
16   echo ("X is <br>");
17   print_r ($x);
18 
19   echo ("<br><br>Y is <br>");
20   print_r ($y);
21 ?>


Waaav! Nothings changes! When you run this code, you will see values of x as 1, 2 and 3 and values of y as 7, 8, 9... The code above seems 100% compatible with the original library...

If you have used RCaller (Java edition) before, you will probably
understand the whole code. If not, lets have a look at the page RCaller 2.0 - Calling R from Java.


Note that, it is as in-efficient as the original version. Because RCaller creates external Rscript processes in each time RunAndReturnResult() thingies called. Be careful before using it in big and critical projects. Another note is about using it with too many users. RCaller uses temp directory to store its R codes and outputs. You need to clear this directory periodically. Otherwise you can have a "too many files" error.


Finally, source of is ready for use and development. Please visit the RCaller source code and downloads page. Php codes are stored as a separate project with name RCallerPhp.

Test it and do not hasitate to ask us!

Monday, October 24, 2011

For what the hell are we using Unity?

Last week, I upgraded my Ubuntu 11.04 to Ubuntu 11.10. This was a milestone in my Linux life.

In 2005, when I was a PhD student, my primary os was Windows XP. It was failing during the boot process but it was telling me nothing about the problem. I thought it was about one of the drivers but I was not the boss of my own computer. That was the reason to give it up and start with a new OS which gives the reins to me. It was Ubuntu, I don't remember the version but It should be 6 or 6.5.

Ubuntu was nice, easy to learn. As a hobbyist Java developer nothing changed by formatting the machine with ext3 and going on with the Gnome.

By the time, the community introduced more enhanced versions of Ubuntu. In each single revision, we get more happy to live with Ubuntu. The performance was perfect, there were lots of deb packages around and we got the chance of playing new games in our Linux boxes.

You know, Unity is the default GUI since Ubuntu 11.04. First time that I used that system, I tried to uninstall it and get the Gnome as soon as possible. In 11.10, I experienced the same thing and I saw that I can really get rid of it. Of course using XFCE or anything else should be the solution. But my problem is about the developer community.

First, why are you setting the Unity as default GUI system? Did people get bored with the GNOME desktop? Was it buggy? Have you performed a comprehensive survey about this?


Ubuntu with a Gnome Desktop is now a public good, because world is using it. People who wants to give it up can give it up. But I think it is wrong someone to make decisions about people use or not to use a GUI system by default...


Finally, I am finalizing the lifetime of Ubuntu in my boxes. The other distribution, Open Suse, seems to be more stable, say that, I am not afraid of being a dummy with my own computer. 


And, when you press Ctrl + Alt + 1 in your Linux Desktop, as you know, a full screen console will be opened. When you log in, you will see a "Have a lot of fun..." message in Open Suse 11. Yes, thank you. I am having fun right now!

Friday, October 21, 2011

Checking System Room Temperature with Cisco, Hp, Netscreen

{ able to visit following link to read newest entry about same subject;
This article has got a mobile phone client application to follow up to system room temperature. That first version is especially for Nokia Phones. }

The "http://stdioe.blogspot.com/2011/09/how-to-follow-up-temperature-of-system_23.html" article is explaining "How to follow up temperature of system room" via an IBM Blade Chassis device. I used to plan to explain how to use it because, the most reliable device on my system room is IBM Blade chassis. But may most of SDTIOE blog users haven't got an IBM blade chassis. Anyway that article can be able to help them ofcourse but I can re-write it for frequently used devices such as Cisco, Juniper and Hp. These products also have different operation systems. So each version has got little differences. This article presents some composite solutions for those systems.

Checking the system room temperature with Cisco:


Cisco routers have internaly got "show environment" or "show environment temperature" commands. We can get the temperature information with these commands. we can also use the article on page "http://stdioe.blogspot.com/2011/09/how-to-follow-up-temperature-of-system_23.html" to get that info from Cisco routers using the script below:

#!/usr/bin/perl

use Net::Telnet::Cisco;

my $session = Net::Telnet::Cisco->new(Host => 'x.x.x.x');
$session->login('TelnetUser', 'TelnetPassword');

# Execute a command
my @output = $session->cmd('show environment');
print @output;

$session->close;


attention!:
Cisco routers have different IOS versions and different IOS's have got different level of detail.

First Cisco example:

The first example is about Cisco 3661. It has got following IOS version;

HostName_Router_3661#show version 
Cisco Internetwork Operating System Software
IOS (tm) 3600 Software (C3660-IK9S-M), Version 12.2(13)T12, RELEASE SOFTWARE (fc1)
Technical Support: http://www.cisco.com/techsupport
Copyright (c) 1986-2004 by cisco Systems, Inc.
Compiled Tue 30-Mar-04 14:38 by ccai
Image text-base: 0x60008940, data-base: 0x61C20000

ROM: System Bootstrap, Version 12.0(6r)T, RELEASE SOFTWARE (fc1)
ROM: 3600 Software (C3660-IK9S-M), Version 12.2(13)T12, RELEASE SOFTWARE (fc1)

HostName_Router_3661 uptime is 7 weeks, 5 days, 11 hours, 21 minutes
System returned to ROM by reload
System restarted at 04:17:12 ISTANBUL Sat Aug 27 2011
System image file is "flash:c3660-ik9s-mz.122-13.T12.bin"

cisco 3660 (R527x) processor (revision 1.0) with 119808K/11264K bytes of memory.
Processor board ID JAC0617A0XT
R527x CPU at 225Mhz, Implementation 40, Rev 10.0, 2048KB L2 Cache
Channelized E1, Version 1.0.
Bridging software.
X.25 software, Version 3.0.0.
SuperLAT software (copyright 1990 by Meridian Technology Corp).
Primary Rate ISDN software, Version 1.1.
Basic Rate ISDN software, Version 1.1.


3660 Chassis type: ENTERPRISE
5 FastEthernet/IEEE 802.3 interface(s)
2 Serial network interface(s)
8 ISDN Basic Rate interface(s)
1 ATM network interface(s)
2 Channelized E1/PRI port(s)
2 Voice FXO interface(s)
2 Voice FXS interface(s)
DRAM configuration is 64 bits wide with parity disabled.
125K bytes of non-volatile configuration memory.
24576K bytes of processor board System flash (Read/Write)

Configuration register is 0x2102

HostName_Router_3661#


This IOS version supports only the "show environment" command and the output is simple. It hasn't got any value about the temperature as shown below:

HostName_Router_3661#show environment 

Power Supply 1 is present.
Thermal status: normal
Input Voltage status: normal
DC Output Voltage status: normal

Power Supply 2 is present.
Thermal status: normal
Input Voltage status: normal
DC Output Voltage status: normal

Board Temperature: normal.

HostName_Router_3661#


We have to grep the "Thermal status:" line and split it using the ":" character and get the usual part. The perl script should be changed for this goal as shown below:

#!/usr/bin/perl
use Net::Telnet::Cisco;
my $session = Net::Telnet::Cisco->new(Host => 'x.x.x.x');
$session->login('userName', 'passWord');
my @output = $session->cmd('show environment');

$session->close;

foreach $item (@output)
{
if(grep(/Thermal status/, $item) == "1") {
($key, $value) = split(/:/,$item);
}
}

sub trim($)
{
my $string = shift;
$string =~ s/^\s+//;
$string =~ s/\s+$//;
return $string;
}


$value = trim($value);
print "theValue:".$value."\n";

# If you want to write result to a file, you can use following part with erase "#" chars.

#open (target, ">tempfile.txt") || die ("Could not open file <br> $!");
#print target "$value";
#close (target);


We can do the parsing step in this Perl script or we can save the output of "show environment" command to a file and than handle it with shell commands. Lets try this way on "Second cisco example":

Second Cisco example:

The second example is about Cisco 38xx. It has got following IOS version;

HostName_Router_3800#show version 
Cisco IOS Software, 3800 Software (C3845-ADVIPSERVICESK9-M), Version 12.4(11)T3, RELEASE SOFTWARE (fc4)
Technical Support: http://www.cisco.com/techsupport
Copyright (c) 1986-2007 by Cisco Systems, Inc.
Compiled Wed 11-Jul-07 21:30 by prod_rel_team

ROM: System Bootstrap, Version 12.4(13r)T, RELEASE SOFTWARE (fc1)

HostName_Router_3800 uptime is 7 weeks, 4 days, 15 hours, 56 minutes
System returned to ROM by power-on
System image file is "flash:c3845-advipservicesk9-mz.124-11.T3.bin"


This product contains cryptographic features and is subject to United
States and local country laws governing import, export, transfer and
use. Delivery of Cisco cryptographic products does not imply
third-party authority to import, export, distribute or use encryption.
Importers, exporters, distributors and users are responsible for
compliance with U.S. and local country laws. By using this product you
agree to comply with applicable laws and regulations. If you are unable
to comply with U.S. and local laws, return this product immediately.

A summary of U.S. laws governing Cisco cryptographic products may be found at:
http://www.cisco.com/wwl/export/crypto/tool/stqrg.html

If you require further assistance please contact us by sending email to
export@cisco.com.

Cisco 3845 (revision 1.0) with 482304K/41984K bytes of memory.
Processor board ID FTX1135A1E0
4 FastEthernet interfaces
2 Gigabit Ethernet interfaces
1 Virtual Private Network (VPN) Module
DRAM configuration is 64 bits wide with parity enabled.
479K bytes of NVRAM.
125440K bytes of ATA System CompactFlash (Read/Write)

Configuration register is 0x2142 (will be 0x2102 at next reload)

HostName_Router_3800#


This IOS version supports only the "show environment" command but the output has higher level of detail when we compare it to "First Example". It has got temperature values as shown below:

HostName_Router_3800#show environment 

SYS PS1 is present.
Fan status: Normal
Input Voltage status: Normal
DC Output Voltage status: Normal
Type: AC
Thermal status: Normal

SYS PS2 is absent.

AUX(-48V) PS1 is present.
Status: Normal

AUX(-48V) PS2 is absent.
Compliance Mode: IEEE 802.af compliant

Fan 1 Normal
Fan 2 Normal
Fan 3 Normal

Fan Speed is Normal

Alert settings:
Intake temperature warning: Enabled, Threshold: 55
Core temperature warning: Enabled, Threshold: 70 (CPU: 90)

Board Temperature: Normal
Internal-ambient temperature = 31, Normal
CPU temperature = 42, Normal
Intake temperature = 24, Normal
Backplane temperature = 25, Normal

Voltage 1(3300) is Normal, Current voltage = 3316 mV
Voltage 2(5150) is Normal, Current voltage = 5153 mV
Voltage 3(2500) is Normal, Current voltage = 2525 mV
Voltage 4(1200) is Normal, Current voltage = 1215 mV

Nominal frequency

HostName_Router_3800#


We are interested in the temperature of system room, so we will use "Backplane temperature" part in this case. But other values are really very helpful for different purposes so you can edit this sample for something else like CPU. In this case, the Perl script records all of the output of "show environment" command to a file and we will handle that work using linux shell commands,

#!/usr/bin/perl
use Net::Telnet::Cisco;
my $session = Net::Telnet::Cisco->new(Host => 'x.x.x.x');
$session->login('userName', 'passWord');
my @output = $session->cmd('show environment');

$session->close;

open (target, ">tempfile.txt") || die ("Could not open file <br> $!");
print target "@output";
close (target);


Right now, all the information that we need is in the text file. We can handle it easily with linux shell commands. Lets continue,

grep "Backplane temperature" tempfile.txt | awk -F ' ' '{print $4}' | awk -F ',' '{print $1}'


The above result is 25 in this sample. We can use this final result as described on "http://stdioe.blogspot.com/2011/09/how-to-follow-up-temperature-of-system_23.html" article.

Checking system room temperature with Juniper / Netscreen:

Right now, I'm using an ISG2000 to prepare this article. The version information is;


Hardware Version: 3010(0)-(04), FPGA checksum: 00000000, VLAN1 IP (0.0.0.0)
Software Version: 6.1.0r3.0, Type: Firewall+VPN


We can use the following command to get the temperature information:

UGC:isg2000-UP(M)-> get chassis 
Chassis Environment:
Power Supply: Good
Fan Status: Good
CPU Temperature: 104'F ( 40'C)
Slot Information:
Slot Type S/N Assembly-No Version Temperature
0 System Board 0079082006000411 0051-005 E01 80'F (27'C), 84'F (29'C)
4 Management 0081082006000307 0049-004 D11 104'F (40'C)
5 ASIC Board 000319230H060098 0050-003 C00
Marin FPGA version 9, Jupiter ASIC version 1, Fresno FPGA version 102
I/O Board
Slot Type S/N Version FPGA version
1 2 port 10/100/1000T 0142092006000038 C00 20
3 2 port 10/100/1000T 0142092006000036 C00 20
4 4 port 10/100 0138082006000020 D01 6
Alarm Control Information:
Power failure audible alarm: disabled
Fan failure audible alarm: disabled
Low battery audible alarm: disabled
Temperature audible alarm: disabled
Normal alarm temperature is 132'F (56'C)
Severe alarm temperature is 150'F (66'C)
UGC:isg2000-UP(M)->


We can use the "|" (pipe) function to get required lines only. (Also This feature exists in Cisco. I try to write different solutions in each single example. But of course you can also use the pipe function in Cisco example.)

UGC:isg2000-UP(M)-> get chassis | include temperature
CPU Temperature: 104'F ( 40'C)
Slot Type S/N Assembly-No Version Temperature
Temperature audible alarm: disabled
Normal alarm temperature is 132'F (56'C)
Severe alarm temperature is 150'F (66'C)
UGC:isg2000-UP(M)->


This output is better, isn't it? Let's write a Perl script to get this info from the Juniper box to a file on our system.

#!/usr/bin/perl

use Net::Telnet::Netscreen ();

my $fw = new Net::Telnet::Netscreen(host=>'x.x.x.x');

$fw->login('username','password') or die $fw->error;

@lines = $fw->cmd("get chassis | include temperature");

open (target, ">tempfile.txt") || die ("Could not open file <br> $!");
print target "@lines";
close (target);


Now, we can use the content of tempfile.txt file. If you want to focus on only only a single line of this content, you can change "temperature" part on "get chassis | include temperature" command but It's not needed because, we can already manipulate that string with grep and awk commands.

Checking system room temperature with HP Procurve switch:

The first step is writing a Perl script to get the temperature information from Hp Procurve Switch. We can use a script as shown below:


#!/usr/bin/perl

use Net::Telnet ();
$session = new Net::Telnet (Timeout => 5,
Telnetmode => 0,
Prompt => '/PROMPTofDEVICE#/',
Host => "x.x.x.x");

# $session->waitfor('/Press any key to continue/');
# $session->print("");

$session->waitfor('/Password: /');
$session->print('PassworDofDevice');

$session->waitfor('/PROMPTofDEVICE#/');

@lines = $session->cmd("show system temperature");

$session->cmd("exit");

open (target, ">tempfile.txt") || die ("Could not open file <br> $!");
print target "@lines";
close (target);


When we connect to a Procurve device, a "Press any key to continue" expression is shown. Some versions don't require this message to be shown. If you want this message to be shown, you can delete the '#' chars at the beginning of lines. The tempfile.txt file contains the information below:

 System Air Temperatures
# |Current Temp | Max Temp | Min Temp | Threshold | OverTemp
-------+-------------+----------+----------+-----------+----------
Sys-1 | 20C | 29C | 14C | 55C | NO


We can use a command as follows:

grep Sys-1 tempfile.txt | awk -F ' ' '{print $3}'


We can add that script to crontab and record output to mysql table. The other script/service can analyze recorded values like "http://stdioe.blogspot.com/2011/09/how-to-follow-up-temperature-of-system_23.html" article.

Friday, October 14, 2011

Installing the mrtg and the auto analyzer script

I want to explain the mrtg installation on Debian from scratch. It might be boring for expert users but anyway this article is said to be effective for beginners. Expert users may jump on text.

Download the last version of Debian for from the URL "http://cdimage.debian.org/debian-cd/6.0.2.1/i386/iso-cd/" and "debian-6.0.2.1-i386-netinst.iso" images. This version is the minimum in size. I selected that version, because I want to see/show all required packages and applications. I have Ubuntu 11.04 and VirtualBox 4.0.4 in my computer. I installed that Debian into the virtual host at VirtualBox with the default (only selected ssh server while installation) installation settings.


apt-get install mrtg


Mrtg is a perl script so the Perl interpreter is required. I'm checking the Perl interpreter:


a) I will need a http server to publish web pages that are generated by the Mrtg script.
b) I will need a php interpreter to analyze html outputs of mrtg script.
c) I will need a mysql database to save some options and data about auto alert generating.

I'm installing apache2, php5 and mysql-server5 for All that requirements;

apt-get install apache2 php5 mysql-server


After than installation, you can see used ports on your linux to check the status of Apache and Mysql services like following image:


You can check the Apache & Php status using the code below:

<?php phpinfo(); ?>


If the file name is "test.php" and path of the directory is "/var/www/", the phpinfo() function should send an output on your browser when you enter the http://youraddress/test.php address. The next step is to test the mysql server and to make a connection between php and mysql servers. You can use the following php script:

<?php
$link = mysql_connect("localhost","root","youPasswordOnPicture")
or die("Error: Can not establish connection to MySQL Server");
?>


If the file name is "testMySQL.php" and path of the directory is "/var/www/", you should not to see nothing on your browser when you enter the http://youraddress/testMySQL.php address. Having a message "Error: Can not establish connection to MySQL Server" means the database server connection is unsuccessful.

If have reached this line without any error/problem, we can jump to mrtg part again: The mrtg script queries your active network devices (routers, switches, firewalls etc.) via SNMP protocol. So you have to configure the snmp settings on your active network devices. I will add a basic snmp setup for some mostly used devices.

You can use following command to generate a mrtg configuration file.

cfgmaker CommunityString@deviceA.of.Ip.Address --output deviceA.cfg


This command creates a file with name "deviceA.cfg". We have to edit some lines in this file like following:

# Created by 
# /usr/bin/cfgmaker CmmntyString@172.28.201.10


### Global Config Options

# for UNIX
WorkDir: /var/www/html/mrtgGraphics/relatedDevice/

# or for NT
# WorkDir: c:\mrtgdata

### Global Defaults

# to get bits instead of bytes and graphs growing to the right
Options[_]: growright, bits

EnableIPv6: no
...
...
..


If you use MS Windows Operation System, simply uncomment the line "WorkDir: c:\mrtgdata" and put a '#' char to comment the line "WorkDir: /var/www/html/mrtgGraphics/relatedDevice/". We are capable to define directions of graphics and unit types of data. Possible choices for bit and byte for unit and frowright and growleft for direction. (Bunun frowright olduÄŸuna emin misin? flowright olabilir mi?)

Each single interface is defined in this configuration file like following:

Target[3661-fasteth00-systemsegment]: 2:CmmntyString@172.28.201.10:
SetEnv[3661-fasteth00-systemsegment]: MRTG_INT_IP="172.28.201.10" MRTG_INT_DESCR="FastEthernet0/0"
MaxBytes[3661-fasteth00-systemsegment]: 12500000
Title[3661-fasteth00-systemsegment]: Traffic Analysis for 3661-FastEthernet0/0 SystemSegment
PageTop[3661-fasteth00-systemsegment]: <h1>Traffic Analysis for 3661-FastEthernet0/0 SystemSegment</h1>
<div id="sysdetails">
<table>
<tr>
<td>System:</td>
<td>UGC_Topkapi_3661 in </td>
</tr>
<tr>
<td>Maintainer:</td>
<td>Name of The Responsible Person</td>
</tr>
<tr>
<td>Description:</td>
<td>FastEthernet0/0 Connection to SYSTEM Segment </td>
</tr>
<tr>
<td>ifType:</td>
<td>ethernetCsmacd (6)</td>
</tr>
<tr>
<td>ifName:</td>
<td>Fa0/0</td>
</tr>
<tr>
<td>Max Speed:</td>
<td>12.5 MBytes/s</td>
</tr>
<tr>
<td>Ip:</td>
<td>172.28.201.10 ()</td>
</tr>
</table>
</div>


"3661-fasteth00-systemsegment" is the filename of generated html file in path "/var/www/html/mrtgGraphics/relatedDevice/". Each interface has got a different filename like "3661-fasteth00-systemsegment". We have to keep " 2:CmmntyString@172.28.201.10:" part in that configuration file but we can change the other parts such as title, pagetop, and other expressions between html tags.

When we finish editing the configuration file, we have to execute mrtg command with this configuration file as below:

/bin/env LANG=C /usr/bin/mrtg /etc/mrtg/cfg-files/3661.cfg


But the problem is, this command should be re-executed every 5 minutes to get statistics continuously. We can use crontab for this goal. The crontab line is like following for this sample,

*/5 * * * * /bin/env LANG=C /usr/bin/mrtg /etc/mrtg/cfg-files/3661.cfg >/dev/null 2<&1


My MRTG server has got a lot of cfg files and I prepared crontab lines are like this,

0,5,10,15,20,25,30,35,40,45,50,55 * * * * /bin/env LANG=C /usr/bin/mrtg /etc/mrtg/cfg-files/3661.cfg >/dev/null 2<&1
1,6,11,16,21,26,31,36,41,46,51,56 * * * * /bin/env LANG=C /usr/bin/mrtg /etc/mrtg/cfg-files/otherfile.cfg >/dev/null 2<&1
2,7,12,17,22,27,32,37,42,47,52,57 * * * * /bin/env LANG=C /usr/bin/mrtg /etc/mrtg/cfg-files/anotherfile.cfg >/dev/null 2<&1


At this point, our MRTG structure is ready for use. The generated html files are located in path "/var/www/html/mrtgGraphics/relatedDevice/".

[root@mrtg relatedDevice]# ls -l | grep 3661-fasteth00-systemsegment
-rw-r--r-- 1 root root 4649 2011-10-13 16:45 3661-fasteth00-systemsegment-day.png
-rw-r--r-- 1 root root 6951 2011-10-13 16:45 3661-fasteth00-systemsegment.html
-rw-r--r-- 1 root root 98062 2011-10-13 16:45 3661-fasteth00-systemsegment.log
-rw-r--r-- 1 root root 4548 2011-10-13 15:30 3661-fasteth00-systemsegment-month.png
-rw-r--r-- 1 root root 98062 2011-10-13 16:40 3661-fasteth00-systemsegment.old
-rw-r--r-- 1 root root 4337 2011-10-13 16:35 3661-fasteth00-systemsegment-week.png
-rw-r--r-- 1 root root 4756 2011-10-13 04:40 3661-fasteth00-systemsegment-year.png
[root@mrtg relatedDevice]#


If mrtg cfg file has got a lot of interface parts, so lots of html files will be generated. We will need an index page for this situation. We can use following command to generate an index page for our statistics pages.

indexmaker deviceA.cfg > index.html


This command will generate a file with name index.html. We have to move this file to "/var/www/html/mrtgGraphics/relatedDevice/" directory. 3661-fasteth00-systemsegment.html file has got a part like following:

<!-- Begin `Daily' Graph (5 Minute -->
<div class="graph">
<h2>`Daily' Graph (5 Minute Average)</h2>
<img src="3661-fasteth00-systemsegment-day.png" title="day" alt="day" />
<table>
<tr>
<th></th>
<th scope="col">Max</th>
<th scope="col">Average</th>
<th scope="col">Current</th>
</tr>
<tr class="in">
<th scope="row">In</th>
<td>9117.6 kb/s (9.1%)</td>
<td>3139.1 kb/s (3.1%) </td>
<td>5966.2 kb/s (6.0%) </td>
</tr>
<tr class="out">
<th scope="row">Out</th>
<td>9144.2 kb/s (9.1%) </td>
<td>3159.9 kb/s (3.2%) </td>
<td>6001.8 kb/s (6.0%) </td>
</tr>
</table>
</div>
<!-- End `Daily' Graph (5 Minute -->


This part contains numeric values of usage of related interface. We can capture these values every 5 minutes and write to mysql table. Also we can define some limits about that line and compare actual value and limit value. If actual value reaches limit value, the script will be able to generate an alert message. This article is only about the installation of MRTG, Apache http server, php5 and Mysql-Server. The next article will about "how to auto analyze mrtg results with php scripts".